Employment and Unemployment Trends

There’s a lot of talk about the economy and unemployment levels. Depending on who you listen to, you will hear the economy has turned around and is starting to improve or the economy is in a downward spiral and getting much worse. The truth is much more complicated.

There’s a lot of talk about the economy and unemployment levels.  Depending on who you listen to, you will hear the economy has turned around and is starting to improve or the economy is in a downward spiral and getting much worse.  The truth is much more complicated.

The reports can be confusing, especially if you only read the headlines.  For example, the most recent report showed a drop in unemployment, from 9.5% to 9.4%.  The same report showed the number of jobs in the economy decreased by 247,000.   So, how can we have less jobs and lower unemployment?  A big reason for this is the season adjustment to the figures.  The government adjusts employment data based on normal seasonal changes. 

Looking at the unadjusted figures paints a clearer picture.  Below are the unadjusted numbers for May, June and July (in thousands):


May

June

July

Change (May-July)

Number Employed

140,363

140,826

141,055

692

Number Unemployed

13,973

15,095

15,200

1,227

Total Workforce

154,336

155,921

156,255

1,919

Between May and July, the workforce grew by 1.9 million people.  Much of this is a result of students graduating and entering the workforce.  During this time, the number employed also grew, with 692,000 jobs added.  This lead to an increase in the number unemployed, as the number of new workers vastly exceeded the number of new jobs.

So, how could we added so many jobs at a time when the government is reporting job losses?  The government adjusts for seasonal changes.  For examples, many companies in the tourism industry add summer help, and then eliminate the same positions in the fall.  Ordinarily, these companies would have hired a lot of more people.  After adjusting for the typical summer hiring, we have had a loss in jobs. 

Is the economy improving?  The number of people employed hit a bottom in March and has improved since then, with over a million more people employed in July compared to March. During this same time, the number of people unemployed increased by 2 million.  Employment is increasing but at a slower rate than the workforce.  You can use these stats say the economy is getting better or worse.  Add in the seasonal adjustments and you can paint any picture you want.

The overall numbers are good to know, but what is really important is the affect on individuals.  Are people able to find jobs?

The most disturbing statistic is the number of discouraged workers.  A discouraged worker is a person who wants a job but has given up and stopped looking.  The government removes this person from total workforce.  Over the last ten years, we have averaged around 400,000 people who are discouraged.  In July, this total reached 796,000, almost 400k more than normal.

If you are discouraged, frustrated and can’t find a job, giving up may be tempting.  There are nearly 800k people who have done just that.  The economy is tough and jobs are scarce, but there are jobs.  Maintaining a positive attitude  and working hard in your job search are the keys to success.  It isn’t easy, but it is essential. 
Historic Context of Our Current Recession

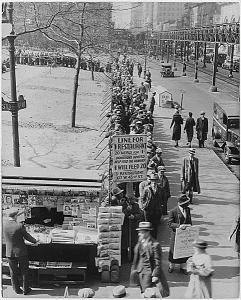
There is a fantastic article in the Wall Street Journal, Obama’s Rhetoric Is the Real ‘Catastrophe,’ comparing our current economic situation to past downturns. The article details several major economic statistics for three time periods, the current situation, the recession of ’81-’82 and the Great Depression.

There is a fantastic article in the Wall Street Journal, comparing our current economic situation to past downturns.  The article details several major economic statistics for three time periods, the current situation, the recession of ’81-’82 and the Great Depression.

The situation today has a lot in common with the situation in 1981, although that recession was a little worse than we are seeing now.  In comparison, the Great Depression is in a category by itself.

One of the statistics from the article that stands out is in regard to unemployment.  The WSJ writes:

“In the last year, the U.S. economy shed 3.4 million jobs. That’s a grim statistic for sure, but represents just 2.2% of the labor force. From November 1981 to October 1982, 2.4 million jobs were lost — fewer in number than today, but the labor force was smaller. So 1981-82 job losses totaled 2.2% of the labor force, the same as now.

Job losses in the Great Depression were of an entirely different magnitude. In 1930, the economy shed 4.8% of the labor force. In 1931, 6.5%. And then in 1932, another 7.1%. Jobs were being lost at double or triple the rate of 2008-09 or 1981-82.”

Our current unemployment would have to triple to approach the worst of the depression.  Last month, we saw a number of positive economic numbers.  I don’t think we’ve turned the corner yet, but we’re not in the death spiral of the early 1930’s either.

It’s important to keep some perspective on the job market when all the news is terrible.  If you are out of work and can’t find a job, it can feel like there is no hope.  Finding a job is tougher today than it was a few years ago – there’s no doubt about that.  It is not impossible, though.

Confidence is a major factor in a job search.  A lack energy and enthusiasm will hurt the impression given in an interview.  It is important to talk about your past successes and demonstrate pride in your accomplishments.  Without energy, enthusiasm and pride, you’re much less likely to succeed.  Self-confidence is often the most difficult aspect of a search to handle.  Losing a job can cause a complete lack of confidence, or worse, mild to severe depression.  Focus on your strengths and past accomplishments.  If you cannot restore your confidence and enthusiasm, seek professional help.


Remember, no matter how bleak the outlook appears, there are still opportunities.  In the late 1920’s and early 1930’s, there were a lot of people that started businesses and began hiring as they grew.  These individuals believed strongly that they could succeed no matter what the economic climate held.  Many failed, but some succeeded.  Below are a few examples of the companies that got their start and fought through the Great Depression successfully:

  • 1929 United Technologies (39th on Fortune 500 List, $54Bil in revenues)
  • 1925 Caterpillar (50th on Fortune 500 List, $45Bil in revenues)
  • 1928 Motorola (65th on the Fortune 500 List, $36Bil in revenues)
  • 1927 Northrup Grumman (76th on the Fortune 500 List, $32Bil in revenues)
  • 1931 Tyson Foods (88th on the Fortune 500 List, $26Bil in revenues)
  • 1930 Publix Super Markets (107th on the Fortune 500 List, $23Bil in revenues)
  • 1926 UAL (124th on the Fortune 500 List, $20Bil in revenues)
  • 1930 Fortune Magazine (Publisher of the Fortune 500 List)

Read the WSJ Article

Industries in Demand

National Unemployment and State Unemployment is only one facet of our employment picture.  Each industry faces a slightly different situation and the unemployment characteristics reflect this.

Manufacturing:  5.3% unemployment.  Looking at the data a little closer, unemployment in Petroleum and Coal Products is 0.2%.  Given the price of oil, it’s not surprise that anyone in that industry can find a job as oil companies try to expand production.  Furniture and Fixtures is a different story with 8.5% unemployment.

Unemployment is the health care field is also low, with 1.4% unemployment in hospital professionals.

Beverage and Tobacco production has a 9.7% unemployment rate, and Food Services professions are at 8.6%. 

Finally, the financial industry has an unemployment level of 3.7%.  That sounds great, and it is for many, but a loan officer or mortgage broker will probably find it tough to get a job right now.

Each industry has a different situation, and the situation varies by geography.  Smaller communities are more dependent on a small group of employers.  If one of these runs into trouble, it can hurt the entire community. 

* Statistics from U.S. Department of Labor, Bureau of Labor Statistics

Where Are The Jobs

The national unemployment rate has been climbing.  Despite this, some parts of the country have very low unemployment.

In April 2008, there were 16 states with unemployment under 4%:

State

Unemployment Rate

South Dakota

2.6

Wyoming

2.6

Idaho

3.1

Nebraska

3.1

North Dakota

3.1

Utah

3.1

Oklahoma

3.2

Hawaii

3.3

Iowa

3.5

New Mexico

3.5

Virginia

3.5

Delaware

3.7

Maryland

3.7

Montana

3.8

New Hampshire

3.8

Arizona

3.9

U.S. Department of Labor Bureau of Labor Statistics